Understanding the Research Process Essay
Descriptive statistics
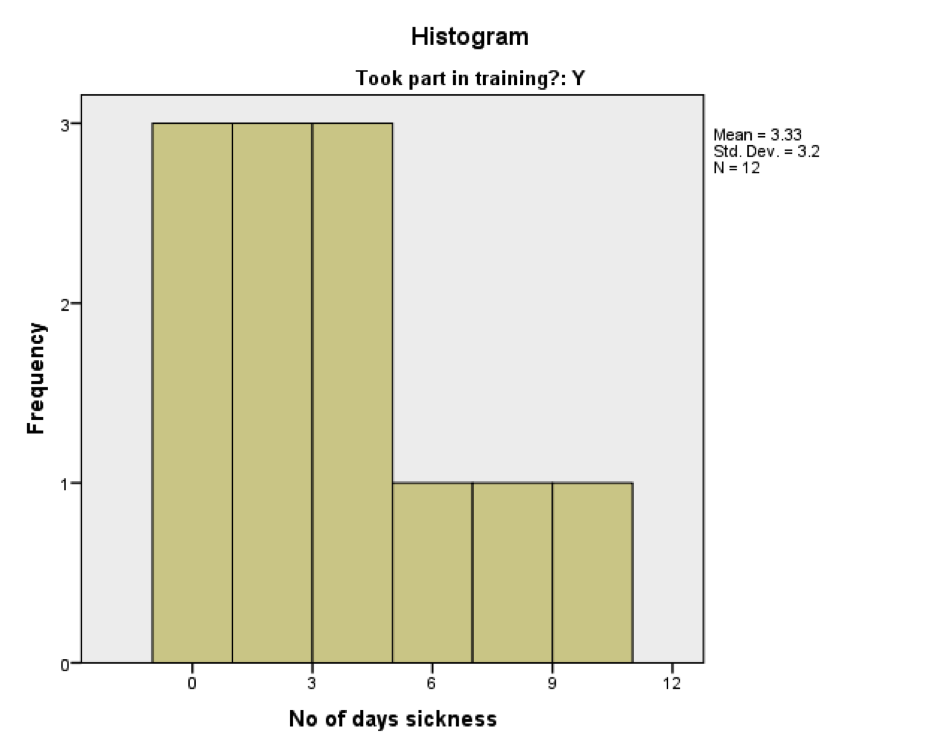
The pie chart below illustrates that the employees who attended the training program were less likely to be absent from work due to sickness. This suggests that the staff training program is effective in combating upper limb injuries. Assuming that upper limb injuries constitute a significant proportion of the reasons why employees are absent from work, it can be concluded that those who do not take part in the training program generally sustain more injuries than those who do. This is further depicted by the histograms for the two sets of employees.

First, it is evident that the employees who did not participate in the training program were generally absent for more days than those who attended the program. This is evidenced by the fact that the former have a mean of 7.08 days while the latter have a mean of 3.33 days. Moreover, the histogram for those employees who did not participate in the program is skewed to the right, which suggests that most of them were absent from work for more than 7 days. On the other end of the spectrum, the histogram for those who participated in the program is skewed to the left, which implies that most of them were absent for less than 3 days. On the bottom line, it is highly likely that employees who participate in the program are absent from work due to less serious illnesses or minor injuries because most of them are only absent for a few days.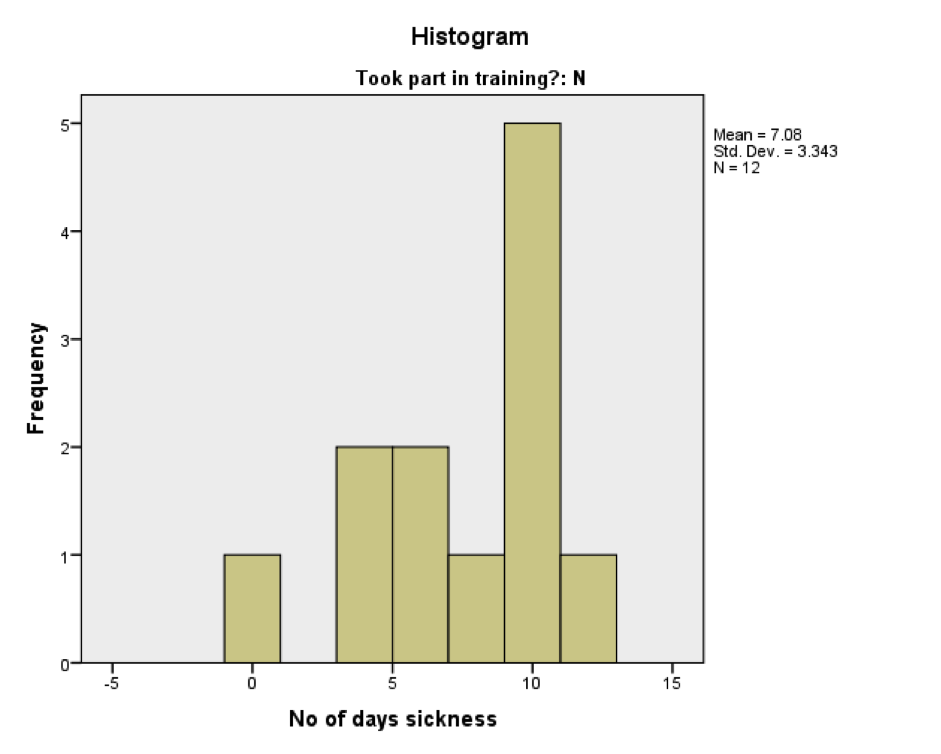
Inferential Statistics
In order to determine whether women suffer from more repetitive strain injuries than men, the number of occupational health consultations and WRULDS problems that the employees have had in the last 12 months will be compared for the two groups. An independent samples T-test is suitable for establishing this relationship because it entails the comparison of two means. Independent samples are used because each ‘case’ or data row represents a different individual. The null hypothesis for both scenarios is that there is no difference between the two population means (), the null and alternative hypothesis for the first scenario can be expressed as follows:
: There is no difference between the number of occupational health consultations among men and women
: There is a difference between the number of occupational health consultations among men and women
From the group statistics above, it is evident that the average number of both occupational health consultations and WURLDS problems is higher for males than for female. As such, it can be concluded that women do not suffer from more repetitive strain injuries than men. It should however be noted that while the difference between the number of occupational health consultations is not statistically significant (), the difference between the number of WURLDS problems is statistically significant (). For this reason, it can only be concluded that men suffer from more repetitive strain injuries than women
Reference
Brase, C. H., & Brase, C. P. (2012). Understanding basic statistics. Pacific Grove, Calif. : Cengage Learning. Research Process
Thanks for taking a look at our sample papers
Do you need any help with your assignment?
Our aim is to help you get the best grades for your Coursework.
We are very confident in our quality of work that we offer you 100% Money back guarantee
Header Button Label: Get StartedGet Started