Recording, Analysing and using Human Resources Information
3RAl F2038 (HR)
CIPD Assessment Activity Template
Title at unlfls Recording. Analysing and Using Human Resources information
Unit Nora 3RAI (HR)
Level Foundation – A
Credit value * # , 2
Assessment method “Written
Learning outcomes: 7 7
1. Understand what data needs to be collected to support HR practices.
2. Know how HR data should be recorded. managed and stored.
3. Be able to analyse HR information and present findings to inform decrsionomaking 1
Both actlvltlos should be completed. .“ Assessment,
Criteria
Activity 1
J Write a report on Data Management which gives at least 2 reasons why organisations 1 1
need to collect HR data, identifying at least 2 types of data to be collected and explain 12
how each supports HR. You should also describe 2 methods of storing records and 2 1
the benefits of each. Give an explanation of 2 essential items of UK legislation relating 2.2
to the recording. storing and accessibility of HR data 1
Activity 2 l
Identity an area of HR data that you will investigate. (such as absence data. records or
new starters or leavers. performance appraisal statistics). the time period you intend to
investigate and the part at the organisation you will focus on. Anatyse this data to 31
identify any trends, patterns. causes and present your findings in a written statement 32
with releirant supporting documents (for example. spreadsheets. tables. graphs or
charts) to illustrate your analysis. I»
f ‘ I
F Evidence to be produced ‘ a
Activity 1:
Report of approximately 750 words.
Activity 2:
Written statement of findings (at approximately 250 words) with supporting documents

Solution
Recording, Analysing and using Human Resources Information
Recording, Analysing and Using HR Information
In HR, human capital is the people at work and their combined skills, knowledge, abilities and capacity to innovate and develop. Human capital reporting provides quantitative and qualitative data on various aspects of the organisation such as employee engagement levels and labour turnover. This helps the organisation identify the kind of HR management involvements that will accelerate business performance. Generally, tangible assets like money, equipment and land, intangibles like reputation, brand and people, who are increasingly becoming vital in this knowledge-based economy, determine the value of an organisation.
The management of human capital is very important, as the ability to attract, retain and improve the employees will continually be a major challenge to HR professionals. To become official employees, most firms require that the employees complete a form. The type of information collected includes, legal names, address, banking information, marital status, beneficiaries for benefits plans, social security and insurance number, and such. The type of data collected, where it is stored and how it is used have changed but the need to collect information from employees has not changed. Data collected in HR is very important in establishing the skill level of the workforce in a company. It also helps predict future performance and engagement of employees. Collecting HR data ensures maintenance of a profile for each employee, which eases payment and compensation to each employee. Another reason for gathering data is for regulatory and liability purpose. The government requires firms, especially larger ones to maintain and report a lot of information to them.
Collection of human capital data, in basic levels, can be from simple observations and monitoring for instance controlling absence and or monitoring retention problems. This helps the firm identify actions needed, for instance to reduce accident rates, reduce absence or even improve the diversity profile. In the intermediate level, firms can design data specifically for HR needs. This could be through an attitude survey measuring satisfaction, or improving people management. As a result, a HR model are developed and integrated to improve the overall performance. At more advanced levels, the management uses such data to recognise performance enhancers. This done through correlating diverse types of data with performance data. Firms can in this case comprehend the real benefits of improving retention and motivation among its employees (ACAS 2009).
Currently, there are complex human resource information systems (HRIS) to manage, analyse and transfer a lot of information. Many assets such as head count and computer systems are primarily gather and store organizational data. Initially, HR systems were paper-based though they are still in use today. Manual paper-based systems are very cheap to set up and the process is very simplified as skills in accounting software are not necessary. They offer easier correction process compared to computerised systems, which leaves behind a trail of complex audit trails. In manual systems, data corruption and loss is at much lower risk especially in controlled environments. Electronic HR systems feature relational databases where data can be stored in more than one file, each comprising of different types of information. Different files can be linked to allow information from individual files be used together. In addition, it is possible to link information from diverse sources and locations. Compared to manual systems, it is more efficient and requires less storage space. It eases the process of recording and generating financial records (ACAS 2009).
Advancements in the levels of absence, change and uncertainty are still ubiquitous and this makes it essential to retain focus on the well-being of employees. The public sector despite the ongoing budget cuts remains more active in health promotion than in the private sector. The major task is retaining the focus, as budgets remain tight. Reviewing the suitability of absence management approaches and that of well-being provision is vital; hence, it should be regular. This will ensure that key issues faced by the employees are effectively addressed. This year saw similar results to those of last year stressing specific areas of attention. Absenteeism is still a concern with a third of organisation studied claiming they had seen a rise in the number of employees coming to work ill last year yet only half of these organisations are taking action. Sickness related absence is gaining a considerable focus for policy makers (CIPD 2013).
Positive developments observed this year have seen a rise including the use of flexible working approaches and initiatives aimed at helping people balance the demands from work and their homes. An increasing number of firms are offering leaves for family circumstances and are constantly altering the working environment and patterns to help manage the absence. This has dramatically reduced the number of sickness related absence in these firms. This report sets forth finding of the CIPD’s fourteenth national survey of the absence management trends, policy and practise in organisations. The analysis is from 618 replies from different organisations and their 2.3 million employees.
Absence Levels
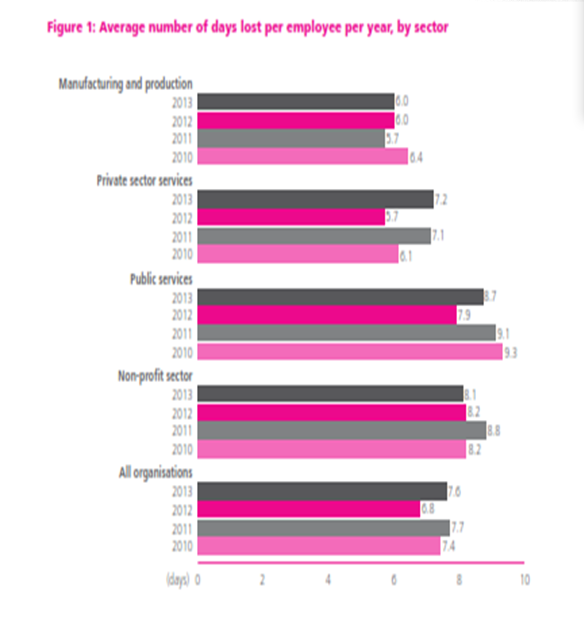
Overall 80% of organisations record the absence rate, rising to 95% in the public sector annually. A minority of them measure absence levels based on age and gender. Last year, there was an average drop in the levels of absence. This year, the levels have gone back up as seen in 2011 and 2010 at 7.6 days per employee. However, there was a considerable variation across organisations this year with some recording an extreme level of absence. The public sector saw the highest absence levels at 8.7 days per employee per year. Manufacturing and production recorded the lowest levels at 6 days per employee per year. These levels increased with organisation size regardless of the sector.
As in the yester years, there is a significant variation in the number of cases of absence with few organisations recording very high absence levels. To avoid skewing the results from these extreme cases, 5% trimmed mean is represented. On average, the level of absenteeism has risen by almost one day per employee compared to last year.
| Table 1: Average level of employee absence, per employee per annum | ||
| Average working time lost per year (%) 5% trimmed Standard mean deviation Mean | Average number of days lost per employee per year 5% trimmed Standard mean deviation Mean | |
| 2013: all employees 2012: all employees 2011: all employees 2010: all employees | 3.3 3.9 3.8 3.0 3.3 3.4 3.4 3.5 3.8 3.2 1.9 3.4 | 7.6 9.0 8.6 6.8 7.5 7.7 7.7 8.0 8.7 7.4 4.3 7.7 |
Both the private and public sectors have contributed to the overall increase in the absence levels as shown in figure 1 below. Average absence levels decreased significantly in both sectors last year but this year the levels returned to levels similar to those of 2011.
Reference List
ACAS. 2009. Personnel data and record keeping. London: ACAS. CIPD. 2013. Annual survey report 2013. London: CIPD.
Is this question part of your Assignment?
We can help
Our aim is to help you get A+ grades on your Coursework.
We handle assignments in a multiplicity of subject areas including Admission Essays, General Essays, Case Studies, Coursework, Dissertations, Editing, Research Papers, and Research proposals
Header Button Label: Get Started NowGet Started Header Button Label: View writing samplesView writing samples