Introduction
A national retail chain is investigating the possibility of leasing premises at an international airport terminal, for an up-front payment of £1 million covering the next five years. The premises will operate as a shop for outbound passengers. This report will evaluate the economic viability of the project using the NPV and IRR criteria. Net present value (NPV) is the difference between the present value of all the benefits and costs of a series of cash flows. For a project proposal to be accepted, the NPV must be positive. On the other hand, the internal rate of return (IRR) is the discount rate that equates the present value of all the benefits from a proposed investment project to the present value of all the costs (Werner & Stoner 2010, p. 523). The IRR rule stipulates that an investment proposal is only viable if the IRR exceeds the cost of capital (the discount rate).
Despite the overwhelming evidence supporting the fact that IRR is not an effective measure for evaluating the viability of a project, most Chief Finance Officers (CFOs) still use IRR to evaluate capital projects. An informal survey of 30 executives carried out by Kelleher & MacCormack (2004) at corporations, venture capital firms and hedge funds revealed that a majority of CFOs were not aware of the most critical deficiencies of IRR. Furthermore, an analysis of 24 investment projects initiated by one company showed that the ranking and overall attractiveness of the projects would have changed considerably if the analysts corrected the IRR for its inherent natural flaws. There are four major shortcomings of the IRR rule as an investment criterion. First, it is not suitable for evaluating mutually exclusive projects. Secondly, it does not take into account the reinvestment rate of interim cash flows. Thirdly, it cannot be used to compare projects with different durations and finally, it is characterized by multiple values when evaluating projects with alternating cash flows. The IRR rule inferior to the NPV rule in evaluating capital projects. It is however not redundant as an investment criterion because it produces consistent results with the NPV rule in several circumstances and also addresses some weaknesses of the NPV rule
Methods
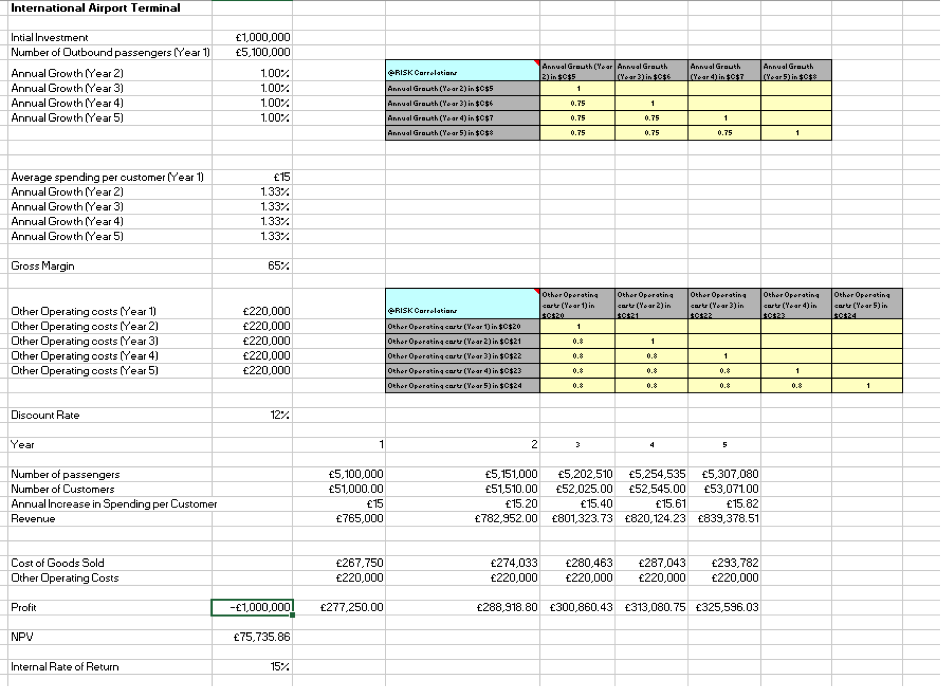
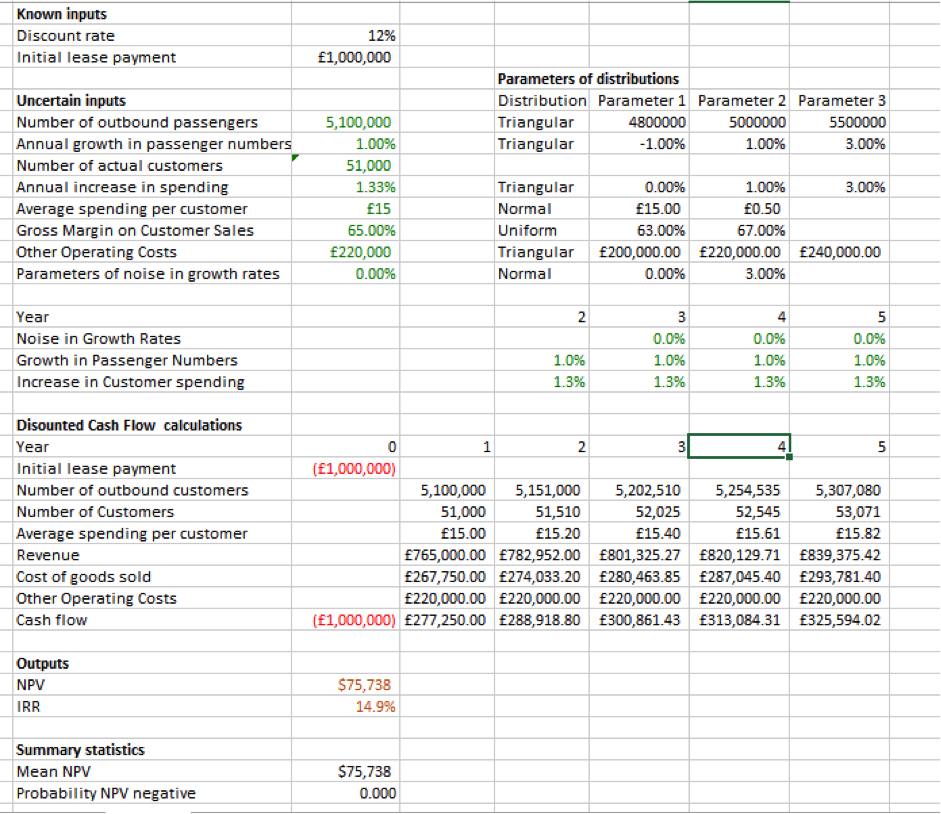
The model is characterised by an initial investment cost (lease payment) incurred at the beginning of the first period and a series of cash inflows at the end of every subsequent year. This net cash inflow is the difference between the total revenue and expenses for each year. Total revenue is a function of the total number of actual customers and the average spending per customer for each year while the expenses constitute the cost of goods sold and other operating costs. The number of outbound customers for each year is assumed to have a triangular distribution that is positively skewed to the right. Similarly, the annual growth in passenger numbers is assumed to have a triangular distribution with a more or less similar level of skewness. It is assumed that for any passenger, there is a 1% chance that they purchase something at the shop and as such, this percentage is taken to be the actual number of customers who purchase items from the shop.
While the average spending per customer is characterised by a normal distribution, the annual increase in spending follows a triangular distribution, which like the first two triangular distributions is heavily skewed to the right. It is worth noting that the standard deviation of the normal distribution for average spending per customer is relatively low compared to the mean, which suggests that there are very modest fluctuations in the average spending per customer for the different years. The gross margin on customer sales, which is used to drive the cost of goods sold, follows a uniform distribution ranging between 63% and 67%. Finally, other operating costs follow a symmetrical triangular distribution with an average value of £220,000.
Findings
It is assumed that growth in the number of outbound customers and the increase in customer spending remains constant throughout the period. This explains why all the outputs are based on the means of uncertain quantities. Using this assumption, the project exhibits a significantly positive NPV and an admirable IRR, which imply that it is viable. When a simulation is carried out with 500 iterations, the mean NPV is found to be £75,997.16 with minimum and maximum NPV values of -£205,974.55 and £404,201.70 respectively. The standard deviation for the NPV is 99,595.45, which is relatively high compared to the mean suggesting that the returns of the project are very volatile. In fact, there is a 25% probability that the NPV will be negative.
Figure 1: Model formulation in Excel
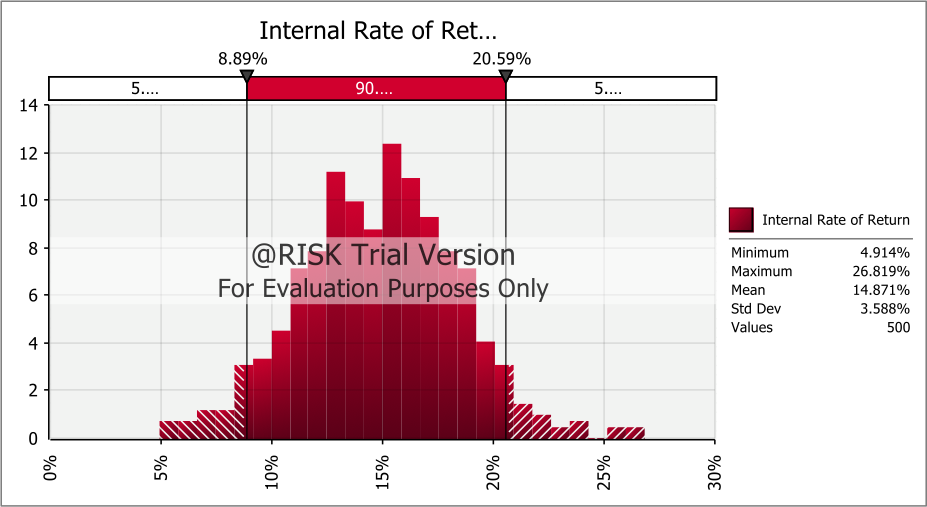
When a similar procedure is performed on the IRR, the project proves to be viable beyond any reasonable doubt because the mean, maximum and minimum IRRs for the iterations are all positive and the standard deviation is relatively small compared to the mean.
Figure 2: @Risk Output for NPV Simulation
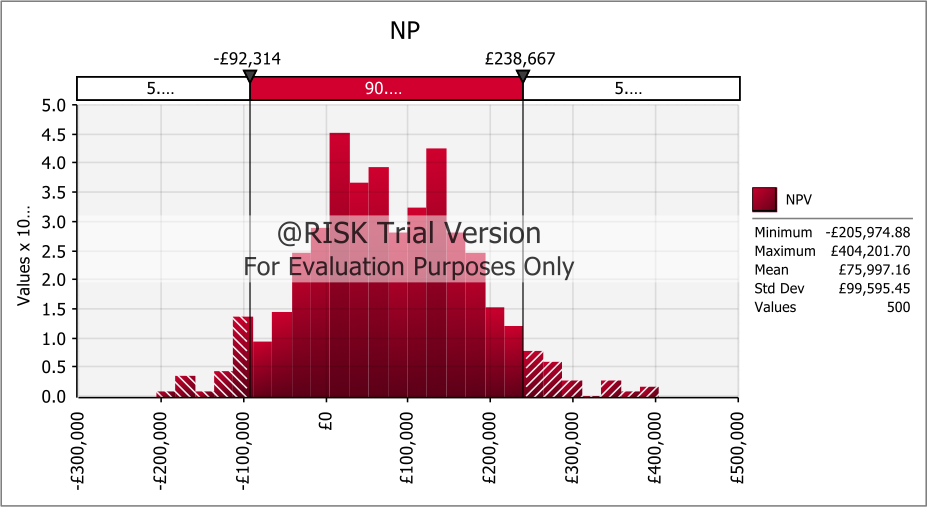
Figure 3: @Risk Output for IRR Simulation
Discussion
From the foregoing, it is evident that when dealing with single or independent projects, IRR and NPV will always give consistent results. In essence, the decision to accept or reject an investment project is the same regardless of the method used to evaluate the viability of the project (Leu, 2010; Osborne, 2010; Weber, 2014). Nevertheless, IRR is not suitable for evaluating mutually exclusive projects. It can only be used to evaluate whether a single project is worth investing in or not (Kierulff, 2012). Because IRR is given as a percentage, it is only possible to estimate the expected return on a project but not the actual contribution of the project to shareholders’ wealth. Projects with a high initial capital outlay tend to have lower IRRs than those with lower start-up capital requirements. The former are therefore more often than not dismissed in favor of the latter when making investment decisions. Such investment decisions could, however, be suboptimal because while a project with a high initial capital outlay could have a low IRR, the NPV could be significantly higher than that of the preferred project with a lower initial capital outlay and consequently a higher IRR (Bosch, et al., 2007). In such a case, the project with a higher NPV should be selected irrespective of the IRR. The NPV is, therefore, the best measure for evaluating and ranking mutually exclusive projects (Tang & Tang, 2003; Osborne, 2004)
Other than that, IRR does not take into account the reinvestment rate of interim cash flows and relies on the assumption that the interim rates of reinvestment are equal to the IRR (Rich & Rose, 2014; Altshuler & Magni, 2012). Where the IRR is significantly higher than a company’s cost of capital, – more than 10% – then the annual equivalent rate of return for a project will be exaggerated. In practice, it is very difficult if not impossible to find other interim projects with similar rates of return to that of the first project (Kelleher & MacCormack 2004). Moreover, IRR cannot be used to compare projects with different durations because it does not take into account the cost of capital. In this case, the Modified Internal Rate of Return (MIRR) should instead be used.
Another limitation of IRR is that it can only give a definite value for standard projects. A project is said to be standard when it is characterized by cash outflows coming first followed only by cash inflows. In such a case, the IRR rule is a perfect substitute for the NPV rule. Otherwise, when the project is characterized by positive cash flows followed by negative cash flows the IRR must be scrutinized and well interpreted before it is used as a substitute for NPV. Such projects are referred to as opposite projects and can include projects such as strip mines and nuclear power plants, which have large cash outflows at the end of the projects that might result in negative cash flows.
Conclusion
The retail chain should invest in this project because it is justified by both the NPV and IRR criteria. The NPV is significantly positive, and the IRR is higher than the discount rate. The company should, however, be cognizant of the fact that these two criteria are suitable for evaluating different types of projects. While the NPV criterion is suitable for evaluating mutually exclusive projects, the IRR criterion is suitable for evaluating independent projects. They should, therefore, bear this in mind while making future investment decisions.
References
Altshuler, D. & Magni, C. A., 2012. Why IRR is Not the Rate of Return for Your Investment: Introducing AIRR to the Real Estate Community. Journal of Real Estate Portfolio Management, 18(2), pp. 219-230.
Bosch, M.-T., Montllor-Serrats, J. & Tarrazon, M.-A., 2007. NPV as a Function of the IRR: The Value Drivers of Investment Projects. Journal of Applied Finance, 17(2), pp. 41-45. Investment Analysis Report
Johnstone, D., 2008. What Does an IRR (or Two) Mean?. Journal of Economic Education, 39(1), pp. 78-87.
Kelleher, J. C. & MacCormack, J. J., 2004. Internal Rate of Return: A Cautionary Tale. The McKinsey Quarterly, 20 October, p. http://www.cfo.com/printable/article.cfm/3304945. Investment Analysis Report
Kierulff, H., 2012. IRR: A Blind Guide. American Journal of Business Education, 5(4), p. 417. Investment Analysis Report
Leu, J.-H., 2010. Market potential prediction for renewable energy application in Taiwan by lanchester’s rules, financial NPV and IRR estimation. Journal of Information & Optimization Sciences, 31(6), p. 1403.
Osborne, M. J., 2004. The Relationship between NPV and IRR in the Presence of a Non-flat Yield Curve. SSRN Working Paper Series, July. Investment Analysis Report
Osborne, M. J., 2010. A resolution to the NPV-IRR debate?. Quarterly Review of Economics and Finance, 50(2), p. 234. Investment Analysis Report
Rich, S. P. & Rose, J. T., 2014. Re-examining an Old Question: Does the IRR Method Implicitly Assume a Reinvestment Rate?. Journal of Financial Education, 40(1/2), pp. 152-166. Investment Analysis Report
Tang, S. L. & Tang, H. J., 2003. The variable financial indicator IRR and the constant economic indicator NPV. The Engineering Economist, 48(1), pp. 69-79.
Weber, T. A., 2014. On the (non-)equivalence of IRR and NPV. Journal of Mathematical Economics, Volume 52, p. 25. Investment Analysis Report
Werner, F. M. & Stoner, J. A. F., 2010. Modern financial managing : continuity and change. 3 ed. St. Paul, MN: Freeload Press.
Appendix
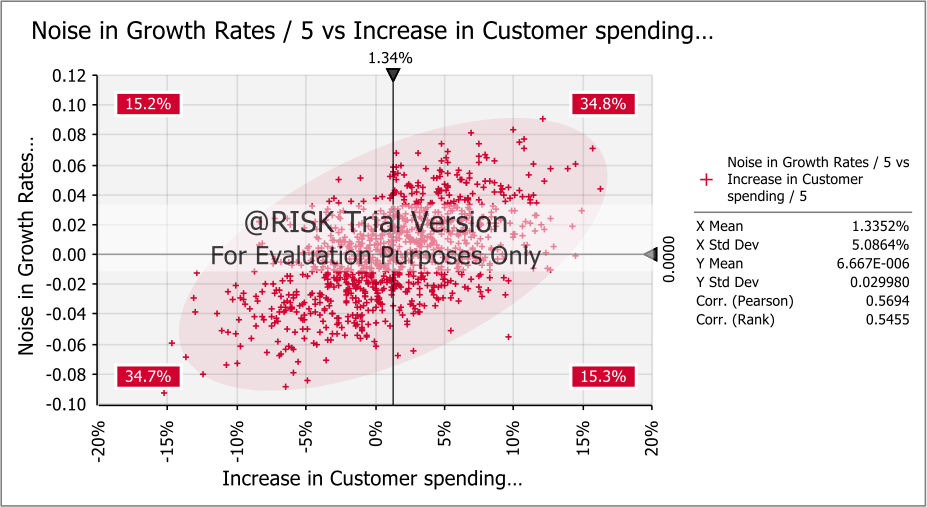
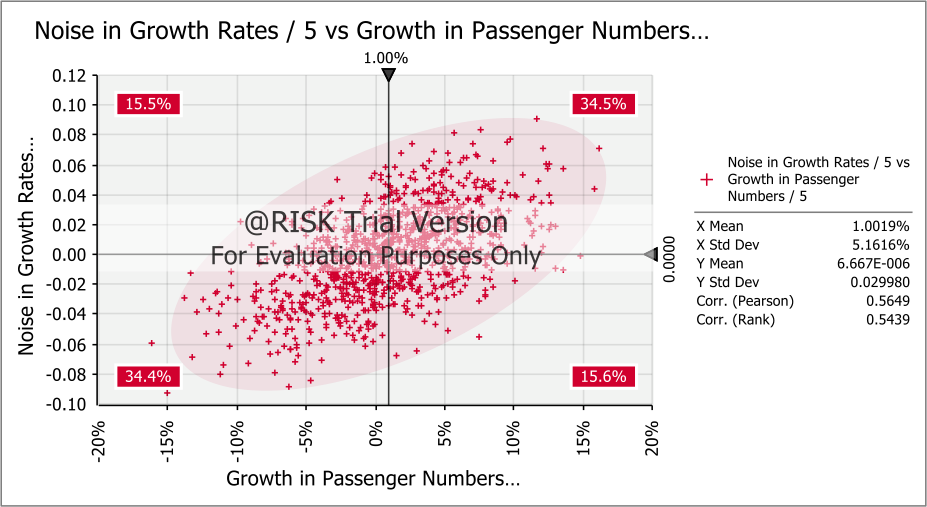
In order to enhance the reliability of the simulation results, 500 iterations were carried out from which the descriptive statistics including the mean, maximum and minimum values were obtained along with the standard deviation. Because the results for both the NPV and IRR are normally distributed, the measures of central tendency coincide with the actual NPV and IRR of the basic model. There results of the analysis can therefore be relied upon for making investment decisions. Notwithstanding, the model is not totally realistic because it assumes the same growth rate each year, which is very unlikely. A more realistic variation of the model can be obtained by correlating the revenue growth rates, even though not as highly as in the initial model which is characterised by perfectly correlated growth rates. This is achieved by adding some degree of noise to the annual growth rates. The noise in any year is hypothetically a normal distribution with a mean of zero and a standard deviation of 3%. This is illustrated in the model below.
Thanks for taking a look at our sample papers
Do you need any help with your assignment?
Our aim is to help you get the best grades for your Coursework.
We are very confident in our quality of work that we offer you 100% Money back guarantee
Header Button Label: Get StartedGet Started