DESCRIPTIVE STATISTICS ON AN HEALTH ISSUE WITHIN A POPULATION AND AN EXECUTIVE SUMMARY IN ADDRESSING THE IDENTIFIED ISSUE.
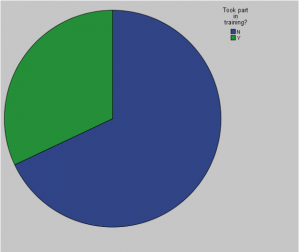
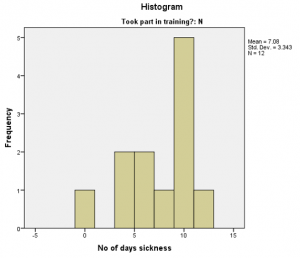
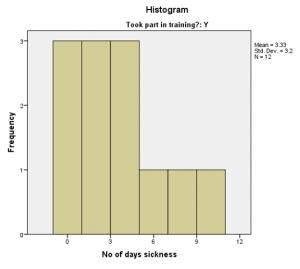
The pie chart below shows descriptive statistics on health issue within a population. It illustrates that the employees who attended the training program were less likely to be absent from work due to sickness. This suggests that the staff training program is effective in combatting upper limb injuries. Assuming that upper limb injuries constitute a significant proportion of the reasons why employees are absent from work, it can be concluded that those who do not take part in the training program generally sustain more injuries than those who do. This is further depicted by the histograms for the two sets of employees.
First, it is evident that the employees who did not participate in the training program were generally absent for more days than those who attended the program. This is evidenced by the fact that the former have a mean of 7.08 days while the latter have a mean of 3.33 days. Moreover, the histogram for those employees who did not participate in the program is skewed to the right, which suggests that most of them were absent from work for more than 7 days. On the other end of the spectrum, the histogram for those who participated in the program is skewed to the left, which implies that most of them were absent for less than 3 days. On the bottom line, it is highly likely that employees who participate in the program are absent from work due to less serious illnesses or minor injuries because most of them are only absent for a few days.
In order to determine whether women suffer from more repetitive strain injuries than men, the number of occupational health consultations and WRULDS problems that the employees have had in the last 12 months will be compared for the two groups. An independent samples T-test is suitable for establishing this relationship because it entails the comparison of two means. Independent samples are used because each ‘case’ or data
Is this question part of your Assignment?
We can help
Our aim is to help you get A+ grades on your Coursework.
We handle assignments in a multiplicity of subject areas including Admission Essays, General Essays, Case Studies, Coursework, Dissertations, Editing, Research Papers, and Research proposals
Header Button Label: Get Started NowGet Started Header Button Label: View writing samplesView writing samples


